
Please refer to important disclosures at the end of this report
1
Incorporated in November 1958, government-owned NMDC is India’s largest
iron ore producer with a capacity of 32mn tonne. The company operates high-
grade iron ore mines in Chhattisgarh and Karnataka. As of March 31, 2011, its
estimated reserves and resources stood at 1,434m tonnes.
Iron ore capacity to expand: NMDC aims to ramp up its production capacity to
48mn tonne by FY2015E (current capacity – 32mn tonne) through increased
exploration of its existing mines and development of new mines, ie, Bailadila
11/B, Kumaraswamy and Deposit 10 & 11/A. However, given its past track
record, we forecast iron ore production capacity to increase to 40mn tonne by
FY2015 (compared to its target of 48mn tonne).
Low cost producer of iron ore: NMDC is one of the lowest cost producers of iron
ore on account of its highly mechanized mines, high-grade iron ore mines and
logistical efficiencies. Further, NMDC (unlike other PSUs such as SAIL and Coal
India) does not face issues of overstaffing.
Seeking to diversify into steel making: NMDC intends to diversify its
operations by moving downstream through establishing steel plants and pellet
plants. Accordingly, the company aims to build an integrated 3mn tonne steel
plant in Jagdalpur, Chhattisgarh with a capex of `15,525cr.
Outlook and valuation:
Over the past five years, NMDC has traded at an
average EV/EBITDA of 11.1x, compared to its upper band price valuation of 3.6x
FY2014E EV/EBITDA. A strong balance sheet, presence in sellers market (iron
ore), low cost of production, high-grade mines and long mine life make NMDC
an attractive bet in our view. Valuing the stock at 5.5x FY2014E EV/EBITDA, we
derive a fair price of `198 and recommend investors to Subscribe to the issue at
the upper price band of `150.
Key financials (Standalone)
Y/E March (` cr) FY2011
FY2012 FY2013E
FY2014E
Net sales 11,369
11,261 11,209
12,525
% chg 82.2
(1.0) (0.5)
11.7
Net profit 6,499
7,266 7,343
8,160
% chg 88.3
11.8 1.1
11.1
FDEPS (`) 16.4
18.3 18.5
20.6
OPM (%) 76.1
79.3 78.4
78.3
P/E (x) 9.2
8.2 8.1
7.3
P/BV (x) 3.1
2.4 2.0
1.6
RoE (%) 38.8
33.3 27.0
24.6
RoCE (%) 50.6
40.1 31.7
29.1
EV/Sales (x) 3.7
3.5 3.4
2.8
EV/EBITDA (x) 4.9
4.4 4.3
3.6
Source: Company, Angel Research
SUBSCRIBE
Issue Open: December 12, 2012
Issue Close: December 12, 2012
Issue Details
Face Value: `1
Present Eq. Paid-up Capital: `396cr
Offer Size: 39.6cr Shares
Post Eq. Paid-up Capital: `396cr
Issue size (amount):* `5,749-5,947cr
Price Band: `145-150
Post-issue implied mkt cap: `61,354cr
Promoters holding Pre-Issue: 90.0%
Promoters holding Post-Issue: 80.0%
Note:*At the lower and u
p
per price band,
respectively
Post Issue Shareholding Pattern
Promoters Group 80.0
MF/Banks/Indian
FIs/FIIs/Public &
Others 20.0
Bhavesh Chauhan
Tel: 022- 39357600 Ext: 6821
Vinay Rachh
Tel: 022- 39357600 Ext: 6841
NMDC
Attractively valued
FPO Note
|
Mining
December 11, 2012

NMDC
|
FPO Note
December 11, 2012
2
Company background
Incorporated in November 1958, government-owned NMDC is India’s largest iron
ore producer with a capacity of 32mn tonne. The company operates high-grade
iron ore mines at Kirandul and Bacheli in Chhattisgarh and Donimalai in
Karnataka. As of March 31, 2011, its estimated reserves and resources stood at
1,434m tonnes with majority of its ore over 64% Fe grade.
Issue details
The FPO comprises an offer for sale of 39.6cr equity shares of face value `1 each.
There is no fresh issue of equity. NMDC has fixed the issue price band at `145-
150 per share.
Exhibit 1: Shareholding Pattern
Particulars
Pre-Issue Post-Issue
No. of shares (%) No. of shares
(%)
Promoter and promoter group
3,56,84,18,180 90.0 3,17,19,46,580
80.0
Total public holding 3,61,53,993 10.0 79,27,69,420
20.0
Total 3,96,47,16,000 100 3,96,47,16,000
100
Source: Source: RHP, Angel Research
NMDC
|
FPO Note
December 11, 2012
3
Investment arguments
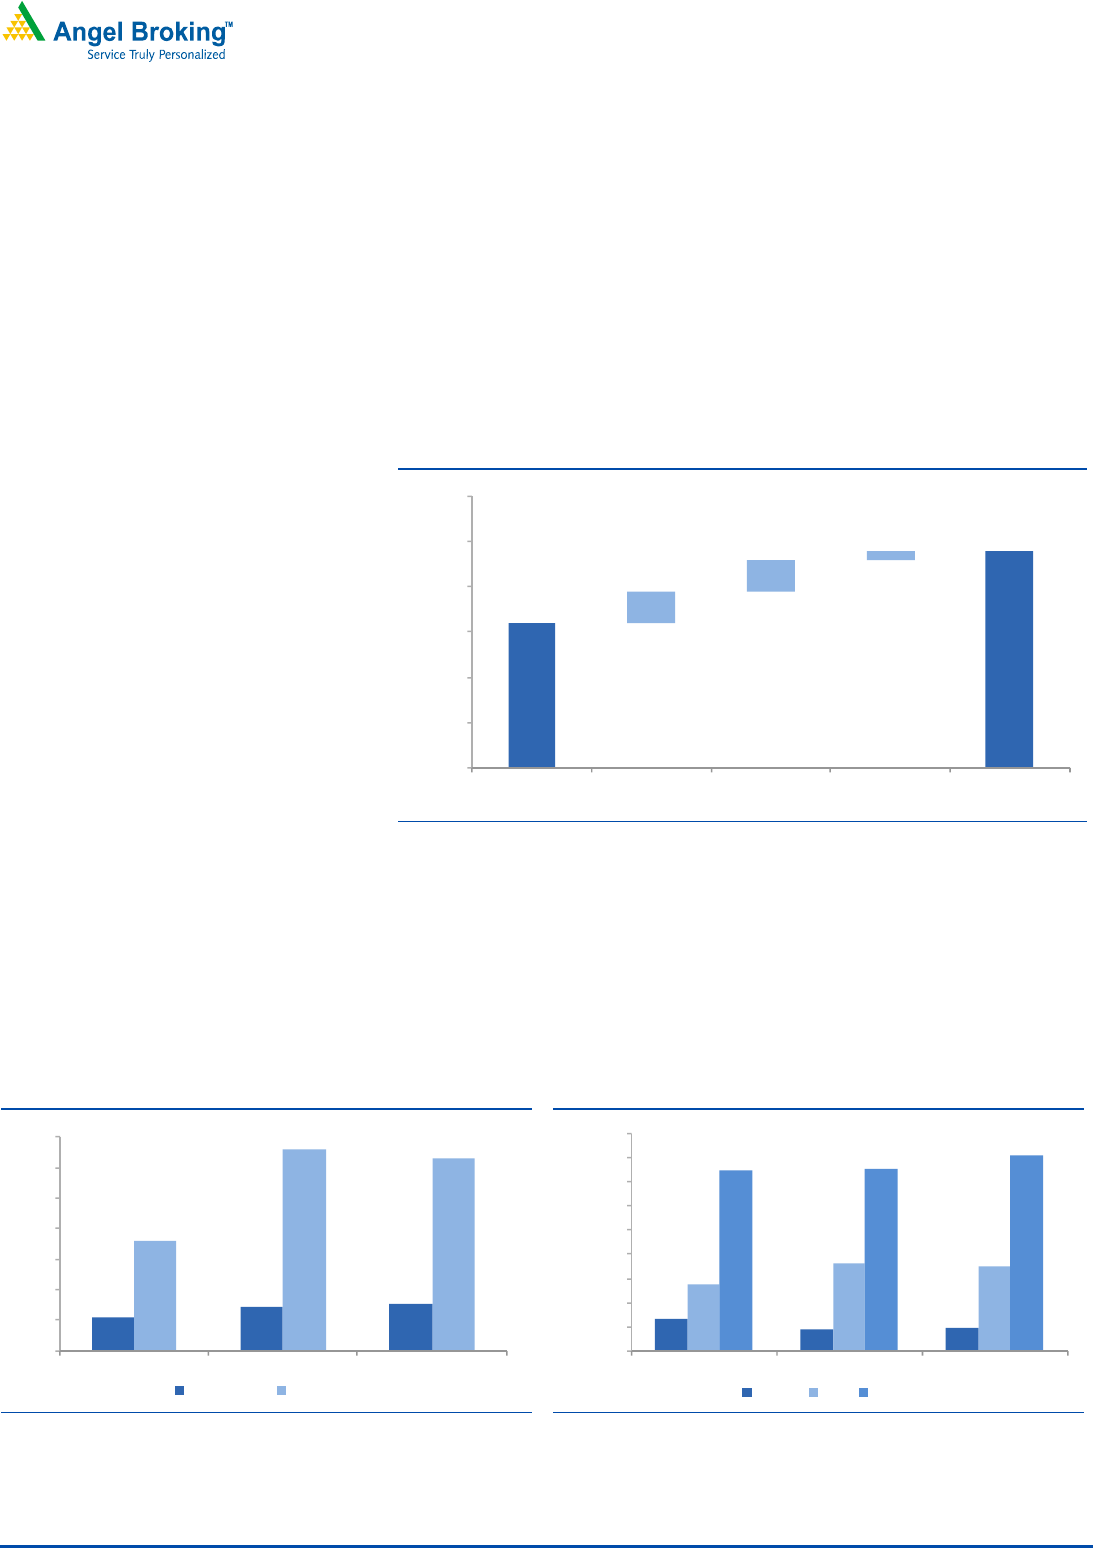
Iron ore capacity to expand
NMDC aims to ramp up its production capacity to 48mn tonne by FY2015E
(current capacity – 32mn tonne) through increased exploration of its existing mines
and development of new mines, ie, Bailadila 11/B, Kumaraswamy and Deposit 10
& 11/A. However, given its past track record, we forecast iron ore production
capacity to increase to 40mn tonne by FY2015 (compared to NMDC’s target of
48mn tonne). In the near term, although we expect sales volumes to remain flat in
FY2013, we expect it to grow by 13.0% yoy during FY2014.
Exhibit 2: Iron ore capacity expansion details
Source: Company, Angel Research
Low cost producer of iron ore
NMDC is one of the lowest cost producers of iron ore on account of its highly
mechanized mines, high-grade iron ore mines and logistical efficiencies. Further,
NMDC (unlike other PSUs such as SAIL and Coal India) does not face issues of
high employees’ costs as a percentage of net sales. Its staff costs/ net sales ratio is
the lowest compared to other PSUs.
Exhibit 3: NMDC’s opex & EBITDA per tonne trend
Source: Company, Angel Research
Exhibit 4: Employee costs as a percentage of sales
Source: Company, Angel Research
32
48
7
7
2
0
10
20
30
40
50
60
Current
Bailadila 11/B Kumaraswamy Dep. 10, 11/
A
Total
(mn tonnes)
11
14
16
36
66
63
0
10
20
30
40
50
60
70
FY2010 FY2011 FY2012
(US$/tonne)
Opex/tonne EBITDA/tonne
6.7
4.3
4.7
13.6
18.0
17.4
37.3
37.7
40.5
-
5.0
10.0
15.0
20.0
25.0
30.0
35.0
40.0
45.0
FY2010 FY2011 FY2012
(%)
NMDC SAIL Coal India

NMDC
|
FPO Note
December 11, 2012
4
Seeking to diversify into steel making
The management intends to diversify its operations by moving downstream
through establishing steel plants and pellet plants. Accordingly, the company aims
to build an integrated 3mn tonne steel plant in Jagdalpur, Chhattisgarh. The land
acquisition for the same is nearly complete, which gives comfort as land
acquisition has been a major bottleneck to greenfield projects in recent times. Also,
NMDC plans to set up another 3mn tonne steel plant in Karnataka in partnership
with the Russian steel giant, Severstal.
Exhibit 5: Chhattisgarh steel project status
Capacity 3mn tonne per year
Capex `15,525cr
Land Total land required: 1,934 acres. Total land acquired: 1,932 acres.
Balance land is under allotment process.
Date of
completion
42 months from “Zero date” i.e., receipt of all statutory
clearance/approvals and placement of orders.
Targeted period – FY2015
S
ource: Company, Angel Research
Outlook and valuation
Over the past five years, NMDC has traded at an average EV/EBITDA of 11.1x
(mainly due to low liquidity), compared to its upper band price valuation of 3.6x
FY2014E EV/EBITDA. Strong balance sheet, presence in sellers market (iron ore),
low cost of production, high-grade mines and long mine life make NMDC an
attractive bet in our view. Valuing the stock at 5.5x FY2014E EV/EBITDA, we derive
a fair price of `198 and recommend investors to Subscribe to the issue at the
upper price band of `150.
Key concerns
Disturbances due to Maoists activities in Bailadila
In the past, NMDC has faced Maoists attacks in Bailadila region. Such attacks
have affected production and movement of iron ore from Bailadila region.
Delays in setting up the steel plant
NMDC is planning to set up steel plants in Chhattisgarh and Karnataka. However,
it does not have experience in setting up steel projects. As such, there could be
potential delays/ cost overruns in its steel projects.

NMDC
|
FPO Note
December 11, 2012
5
Profit & loss statement (Standalone)
Y/E March (` cr) FY2009
FY2010
FY2011 FY2012 FY2013E
FY2014E
Net Sales 7,564
6,239
11,369 11,261 11,209
12,525
Other operating income -
-
- - -
-
Total operating income 7,564
6,239
11,369 11,261 11,209
12,525
% chg 32.4
(17.5)
82.2 (1.0) (0.5)
11.7
Total Expenditure 1,726
1,817
2,722 2,336 2,424
2,713
Net Raw Materials 86
211
123 234 278
344
Personnel 421
420
492 529 548
570
Other 1,219
1,186
2,107 1,573 1,598
1,800
EBITDA 5,838
4,422
8,646 8,925 8,785
9,812
% chg 34.6
(24.2)
95.5 3.2 (1.6)
11.7
(% of Net Sales) 77.2
70.9
76.1 79.3 78.4
78.3
Depreciation& Amortization 74
73
125 130 123
138
EBIT 5,764
4,349
8,521 8,794 8,662
9,674
% chg 34.8
(24.6)
95.9 3.2 (1.5)
11.7
(% of Net Sales) 76.2
69.7
75.0 78.1 77.3
77.2
Interest & other Charges -
-
- - -
-
Other Income 884
862
1,206 2,016 2,298
2,505
Recurring PBT 6,648
5,211
9,727 10,811 10,960
12,179
% chg 34.4
(21.6)
86.7 11.1 1.4
11.1
Extraordinary Inc/(Expense) -
-
- (513) -
-
PBT (reported) 6,648
5,211
9,727 10,760 10,960
12,179
Tax 2,276
1,760
3,228 3,494 3,617
4,019
(% of PBT) 34.2
33.8
33.2 32.5 33.0
33.0
PAT (reported) 4,372
3,451
6,499 7,266 7,343
8,160
ADJ. PAT 4,372
3,451
6,499 7,266 7,343
8,160
% chg 34.5
(21.1)
88.3 11.8 1.1
11.1
(% of Net Sales) 57.8
55.3
57.2 64.5 65.5
65.1
Basic EPS (`) 11.0
8.7
16.4 18.3 18.5
20.6
Fully Diluted EPS (`) 11.0
8.7
16.4 18.3 18.5
20.6
% chg 34.5
(21.1)
88.3 11.8 1.1
11.1

NMDC
|
FPO Note
December 11, 2012
6
Balance sheet (Standalone)
Y/E March FY2009 FY2010 FY2011 FY2012 FY2013E FY2014E
SOURCES OF FUNDS
Equity Share Capital 396 396 396 396 396 396
Reserves& Surplus 11,240 13,876 18,818 24,010 29,635 35,885
Shareholders’ Funds 11,637 14,272 19,215 24,406 30,031 36,281
Total Loans - - - - - -
Deferred Tax Liability 58 85 103 100 100 100
Other Long term Liabilities - - 22 23 23 23
Long Term Provisions - - 15 13 13 13
Total Liabilities 11,695 14,357 19,354 24,543 30,168 36,418
A
PPLICATION OF FUNDS
Gross Block 1,669 1,771 2,273 2,388 3,388 3,888
Less: Acc. Depreciation 923 984 (1,174) (1,199) (1,323) (1,460)
Net Block 747 787 1,099 1,189 2,066 2,428
Capital Work-in-Progress 248 561 568 1,494 4,894 7,894
Goodwill - - - - - -
Investments 72 76 136 248 248 248
Long Term Loans and Advances
- - 199 512 512 512
Other non- current assets - - 11 7 7 7
Current Assets 11,771 14,264 19,086 23,199 24,387 27,325
Cash 9,740 12,855 17,228 20,265 21,483 24,321
Loans & Advances 403 683 557 1,048 1,048 1,048
Other 1,628 726 1,300 1,886 1,856 1,956
Current liabilities 1,165 1,348 1,744 2,105 1,945 1,995
Net Current Assets 10,606 12,916 17,342 21,094 22,442 25,330
Mis. Exp. not written off 22 17 - - - -
Total Assets 11,695 14,357 19,354 24,543 30,168 36,418

NMDC
|
FPO Note
December 11, 2012
7
Cash flow statement (Standalone)
Y/E March (` cr) FY2009
FY2010
FY2011 FY2012 FY2013E
FY2014E
Profit before tax 6,648
5,207
9,726 10,760 10,960
12,179
Depreciation 74
73
122 184 123
138
Change in Working Capital (785)
926
(525) (889) (129)
(50)
Others (866)
(832)
(1,144) (1,962) -
-
Direct taxes paid (2,292)
(1,770)
(3,318) (3,502) (3,617)
(4,019)
Cash Flow from Operations 2,778
3,604
4,862 4,595 7,337
8,247
Inc./ (Dec.) in Fixed Assets (389)
(422)
(456) (1,211) (4,400)
(3,500)
Other income 880
828
(3,961) 472 -
-
Cash Flow from Investing 491
407
(4,417) (739) (4,400)
(3,500)
Issue of Equity -
-
- - -
-
Inc./(Dec.) in loans -
-
- - -
-
Dividend Paid (Incl. Tax) (728)
(895)
(994) (1,911) (1,718)
(1,909)
Others -
-
- (0.1) -
-
Cash Flow from Financing (728)
(895)
(994) (1,911) (1,718)
(1,909)
Inc./(Dec.) in Cash 2,541
3,115
(550) 1,945 1,219
2,838
Opening Cash balances 7,199
9,740
1,648 1,153 3,098
21,483
Closing Cash balances 9,740
12,855
1,153 3,098 21,483
24,321

NMDC
|
FPO Note
December 11, 2012
8
Key ratios
Y/E March FY2009
FY2010
FY2011 FY2012 FY2013E
FY2014E
Valuation Ratio (x)
P/E (on FDEPS) 13.6
17.2
9.2 8.2 8.1
7.3
P/CEPS 13.4
16.9
9.0 8.0 8.0
7.2
P/BV 5.1
4.2
3.1 2.4 2.0
1.6
Dividend yield (%) 1.5
1.2
1.4 2.1 2.5
2.7
EV/Sales 6.6
7.5
3.7 3.5 3.4
2.8
EV/EBITDA 8.5
10.5
4.9 4.4 4.3
3.6
EV / Total Assets 4.2
3.2
2.2 1.6 1.3
1.0
Per Share Data (`)
EPS (Basic) 11.0
8.7
16.4 18.3 18.5
20.6
EPS (fully diluted) 11.0
8.7
16.4 18.3 18.5
20.6
Cash EPS 11.2
8.9
16.7 18.7 18.8
20.9
DPS 2.2
1.7
2.2 3.2 3.7
4.1
Book Value 29.4
36.0
48.5 61.6 75.7
91.5
Dupont Analysis
EBIT margin 76.2
69.7
75.0 78.1 77.3
77.2
Tax retention ratio (%) 65.8
66.2
66.8 67.7 67.0
67.0
Asset turnover (x) 5.2
3.8
6.7 3.7 1.8
1.2
ROIC (Post-tax) 261.7
174.0
333.3 197.7 93.1
63.9
Cost of Debt (Post Tax)
Returns (%)
ROCE (Pre-tax) 57.7
33.4
50.6 40.1 31.7
29.1
Angel ROIC (Pre-tax) 454.4
347.9
744.9 444.2 284.9
258.0
ROE 43.9
26.6
38.8 33.3 27.0
24.6
Turnover ratios (x)
Asset Turnover (Gross Block) 4.9
3.6
5.6 4.8 3.9
3.4
Inventory / Sales (days) 64
60
56 72 65
60
Receivables (days) 50
25
16 24 24
24
Payables (days) 81
105
54 63 63
63
WC cycle (ex-cash) (days) 33
34
11 21 25
22
Solvency ratios (x)
Net debt to equity (0.8)
(0.9)
(0.9) (0.8) (0.7)
(0.7)
Net debt to EBITDA (1.7)
(2.9)
(2.0) (2.3) (2.5)
(2.5)
Interest Coverage (EBIT / Interest)
-
-
- - -
-

NMDC
|
FPO Note
December 11, 2012
9
Research Team Tel: 022 - 39357800 E-mail: [email protected] Website: www.angelbroking.com
DISCLAIMER
This document is solely for the personal information of the recipient, and must not be singularly used as the basis of any investment
decision. Nothing in this document should be construed as investment or financial advice. Each recipient of this document should make
such investigations as they deem necessary to arrive at an independent evaluation of an investment in the securities of the companies
referred to in this document (including the merits and risks involved), and should consult their own advisors to determine the merits and
risks of such an investment.
Angel Broking Limited, its affiliates, directors, its proprietary trading and investment businesses may, from time to time, make
investment decisions that are inconsistent with or contradictory to the recommendations expressed herein. The views contained in this
document are those of the analyst, and the company may or may not subscribe to all the views expressed within.
Reports based on technical and derivative analysis center on studying charts of a stock's price movement, outstanding positions and
trading volume, as opposed to focusing on a company's fundamentals and, as such, may not match with a report on a company's
fundamentals.
The information in this document has been printed on the basis of publicly available information, internal data and other reliable
sources believed to be true, but we do not represent that it is accurate or complete and it should not be relied on as such, as this
document is for general guidance only. Angel Broking Limited or any of its affiliates/ group companies shall not be in any way
responsible for any loss or damage that may arise to any person from any inadvertent error in the information contained in this report.
Angel Broking Limited has not independently verified all the information contained within this document. Accordingly, we cannot testify,
nor make any representation or warranty, express or implied, to the accuracy, contents or data contained within this document. While
Angel Broking Limited endeavours to update on a reasonable basis the information discussed in this material, there may be regulatory,
compliance, or other reasons that prevent us from doing so.
This document is being supplied to you solely for your information, and its contents, information or data may not be reproduced,
redistributed or passed on, directly or indirectly.
Angel Broking Limited and its affiliates may seek to provide or have engaged in providing corporate finance, investment banking or
other advisory services in a merger or specific transaction to the companies referred to in this report, as on the date of this report or in
the past.
Neither Angel Broking Limited, nor its directors, employees or affiliates shall be liable for any loss or damage that may arise from or in
connection with the use of this information.
Note: Please refer to the important `Stock Holding Disclosure' report on the Angel website (Research Section). Also, please refer to the
latest update on respective stocks for the disclosure status in respect of those stocks. Angel Broking Limited and its affiliates may have
investment positions in the stocks recommended in this report.
Disclosure of Interest Statement NMDC
1. Analyst ownership of the stock No
2. Angel and its Group companies ownership of the stock No
3. Angel and its Group companies' Directors ownership of the stock No
4. Broking relationship with company covered No
Note: We have not considered any Exposure below
`
1 lakh for Angel, its Group companies and Directors

NMDC
|
FPO Note
December 11, 2012
10
6
th
Floor, Ackruti Sta
r
, Central Road, MIDC, Andheri (E), Mumbai-
400 093. Tel: (022) 39357800
Research Team
Fundamental:
Sarabjit Kour Nangra VP-Research, Pharmaceutical [email protected]
V
aibhav Agrawal VP-Research, Banking [email protected]
Bhavesh Chauhan Sr. Analyst (Metals & Mining) [email protected]
V
iral Shah Sr. Analyst (Infrastructure) [email protected]
V
Srinivasan Analyst (Cement, Power, FMCG) [email protected]
Yaresh Kothari Analyst (Automobile) [email protected]
A
nkita Somani Analyst (IT, Telecom) [email protected]
Sourabh Taparia Analyst (Banking) [email protected]
V
A
Shareen Batatawala Research Associate shareen.batatawala@angelbroking.com
Tejashwini Kumari Research Associate [email protected]
Technicals:
Shardul Kulkarni Sr. Technical Analyst [email protected]
Sameet Chavan Technical Analyst sameet.chavan@angelbroking.com
Sacchitanand Uttekar Technical Analyst [email protected]
Derivatives:
Institutional Sales Team:
Mayuresh Joshi VP - Institutional Sales [email protected]
Hiten Sampat Sr. A.V.P- Institution sales [email protected]
A
kshay Shah Sr. Executive akshayr.shah@angelbroking.com
Production Team:
Dilip Patel Production Incharge dilipm.patel@angelbroking.com
A
ngel Broking Ltd: BSE Sebi Regn No : INB 010996539 / CDSL Regn No: IN - DP - CDSL - 234 - 2004 / PMS Regn Code: PM/INP000001546 Angel Securities Ltd:BSE: INB010994639/INF010994639 NSE: INB230994635/INF230994635 Membership numbers: BSE 028/NSE:09946
A
ngel Capital & Debt Market Ltd: INB 231279838 / NSE FNO: INF 231279838 / NSE Member code -12798 Angel Commodities Broking (P) Ltd: MCX Member ID: 12685 / FMC Regn No: MCX / TCM / CORP / 0037 NCDEX : Member ID 00220 / FMC Regn No: NCDEX / TCM / CORP /